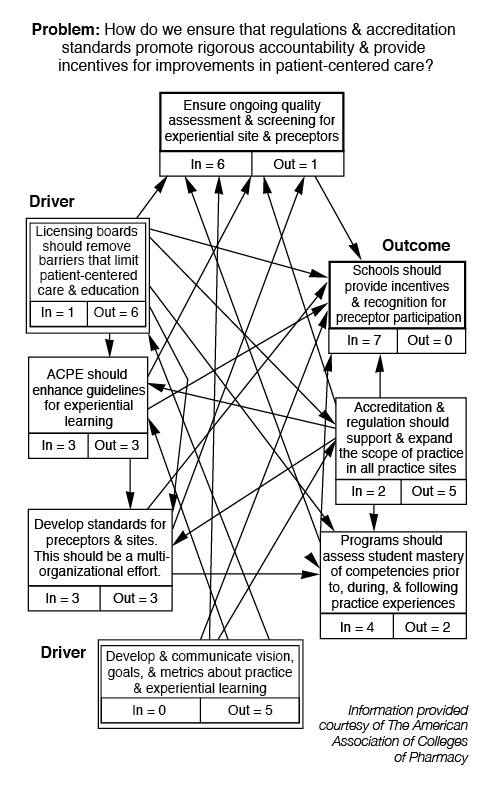
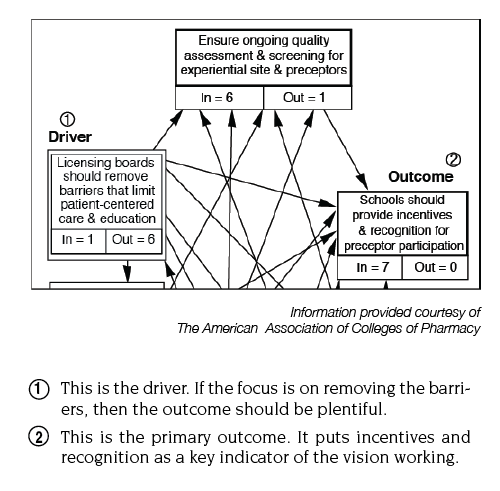
 Interrelationship Digraph (ID)
Why use it?
To allow a team to systematically identify, analyze, and classify the cause and effect relationships that exist among all critical issues so that key drivers or outcomes can become the heart of an effective solution.
What does it do?
- Encourages team members to think in multiple directions rather than linearly
- Explores the cause and effect relationships among all the issues, including the most controversial
- Allows the key issues to emerge naturally rather than allowing the issues to be forced by a dominant or powerful team member
- Systematically surfaces the basic assumptions and reasons for disagreements among team members
- Allows a team to identify root cause(s) even when credible data doesn’t exist
How do I do it?
- Agree on the issue/problem statement.

- If using an original statement (it didn’t come from a previous tool or discussion), create a complete sentence that is clearly understood and agreed on by team members.
- If using input from other tools (such as an Affinity Diagram), make sure that the goal under discussion is still the same and clearly understood.
- Assemble the right team.
- The ID requires more intimate knowledge of the subject under discussion than is needed for the Affinity. This is important if the final cause and effect patterns are to be credible.
- The ideal team size is generally 4–6 people. However, this number can be increased as long as the issues are still visible and the meeting is well facilitated to encourage participation and maintain focus.
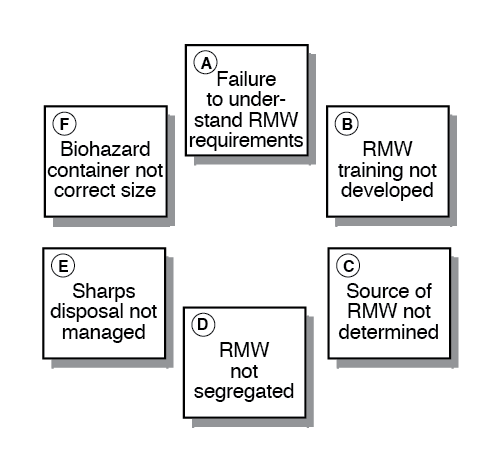
- Lay out all of the ideas/issue cards that have either been brought from other tools or brainstormed.
Arrange 5–25 cards or notes in a large circular pattern, leaving as much space as possible for drawing arrows. Use large, bold printing, including a large number or letter on each idea for quick reference later in the process.
- Look for cause/influence relationships between all of the ideas and draw relationship arrows.
- Choose any of the ideas as a starting point. If all of the ideas are numbered or lettered, work through them in sequence.
- An outgoing arrow from an idea indicates that it is the stronger cause or influence.
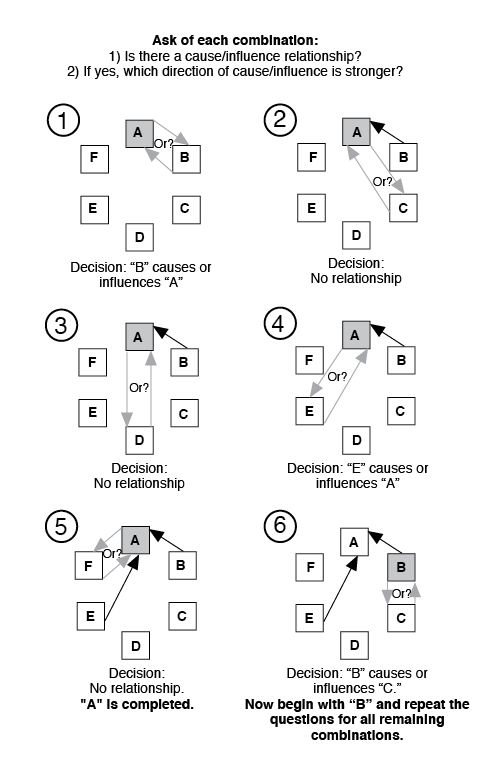
- Review and revise the first-round ID.
- Get additional input from people who are not on the team to confirm or modify the team’s work. Either bring the paper version to others or reproduce it using available software. Use a different size print or a color marker to make additions or deletions.
- Tally the number of outgoing and incoming arrows and select key items for further planning.
- Record and clearly mark next to each issue the number of arrows going in and out of it.
- Find the item(s) with the highest number of outgoing arrows and the item(s) with the highest number of incoming arrows.
- Outgoing arrows. A high number of outgoing arrows indicates an item that is a root cause or driver. This is generally the issue that teams tackle first.
- Incoming arrows. A high number of incoming arrows indicates an item that is a key outcome. This can become a focus for planning either as a meaningful measure of overall success or as a redefinition of the original issue under discussion.
- Draw the final ID.
- Identify visually both the key drivers (greatest number of outgoing arrows) and the key outcomes (greatest number of incoming arrows). Typical methods are double boxes or bold boxes.

- Identify visually both the key drivers (greatest number of outgoing arrows) and the key outcomes (greatest number of incoming arrows). Typical methods are double boxes or bold boxes.
Variations
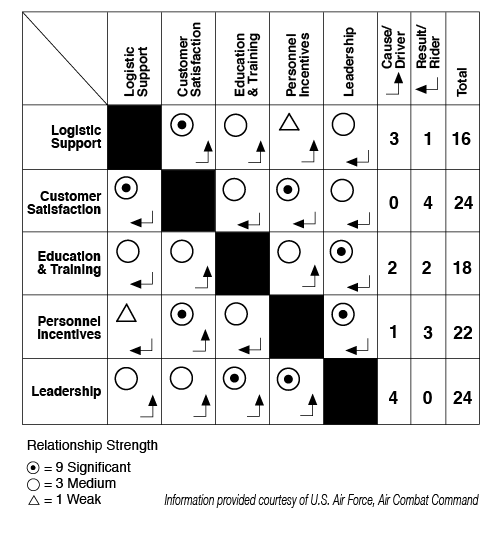
When it is necessary to create a more orderly display of all of the relationships, a matrix format is very effective. The vertical (up) arrow is a driving cause and the horizontal (side) arrow is an effect. The example below has added symbols indicating the strength of the relationships.
The ”total“ column is the sum of all of the ”relationship strengths“ in each row. This shows that you are working on those items that have the strongest effect on the greatest number of issues.

Note: “The drivers” from an ID can be used as the goal in a Tree Diagram.
