Cause & Effect/FishBone Diagram
Why use it?
To allow a team to identify, explore, and graphically display, in increasing detail, all of the possible causes related to a problem or condition to discover its root cause(s).
What does it do?
- Enables a team to focus on the content of the problem, not on the history of the problem or differing personal interests of team members
- Creates a snapshot of the collective knowledge and consensus of a team around a problem. This builds support for the resulting solutions
- Focuses the team on causes, not symptoms
How do I do it?
- Select the most appropriate cause & effect format. There are two major formats:
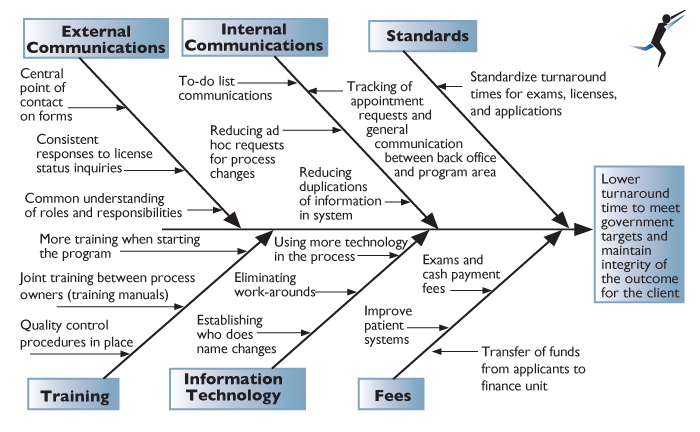
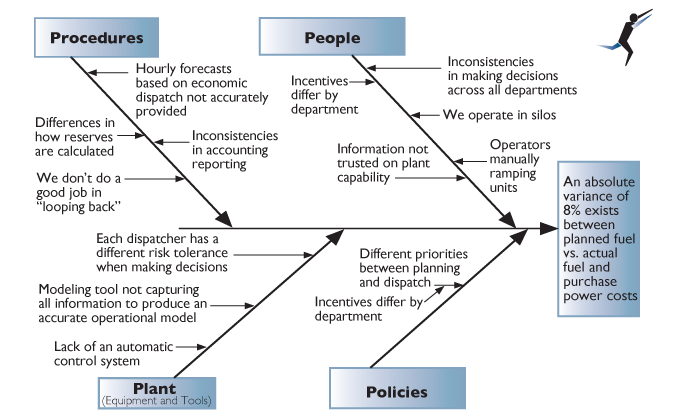
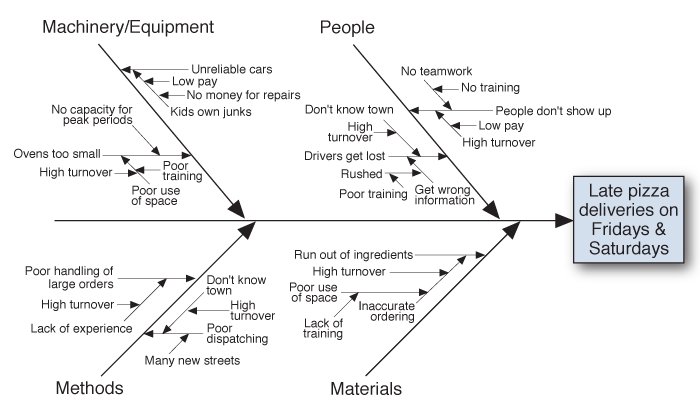
- The Dispersion Analysis Type is constructed by placing individual causes within each “major” cause, category and then asking of each individual cause “Why does this cause (dispersion) happen?” This question is repeated for the next level of detail until the team runs out of causes. The graphic examples shown in Step 3 of this tool section are based on this format.
- The Process Classification Type uses the major steps of the process in place of the major cause categories. The root cause questioning process is the same as the Dispersion Analysis Type.
- Generate the causes needed to build a Cause & Effect Diagram. Choose one method:
- Brainstorming without previous preparation
- Check Sheets based on data collected by team members before the meeting
- Construct the Cause & Effect/Fishbone Diagram.
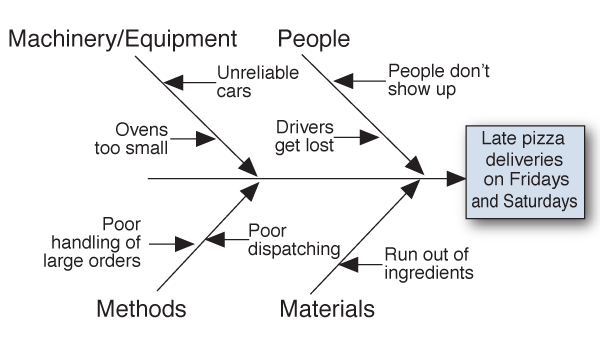
a) Place the problem statement in a box on the right-hand side of the writing surface.
- Allow plenty of space. Use a flipchart sheet, butcher paper, or a large white board. A paper surface is preferred to allow the final Cause & Effect Diagram to be moved.
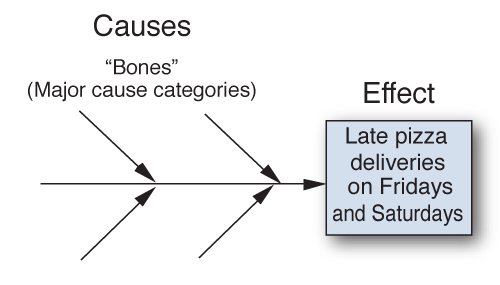
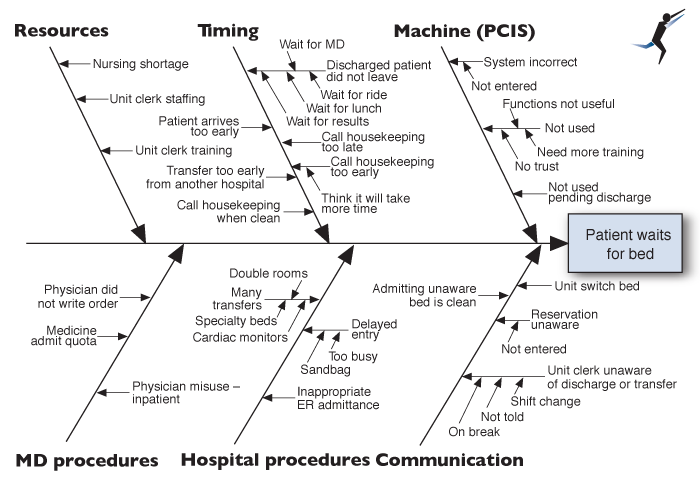
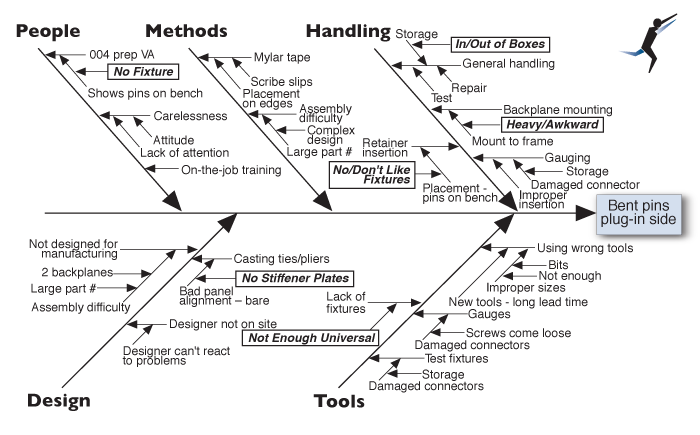
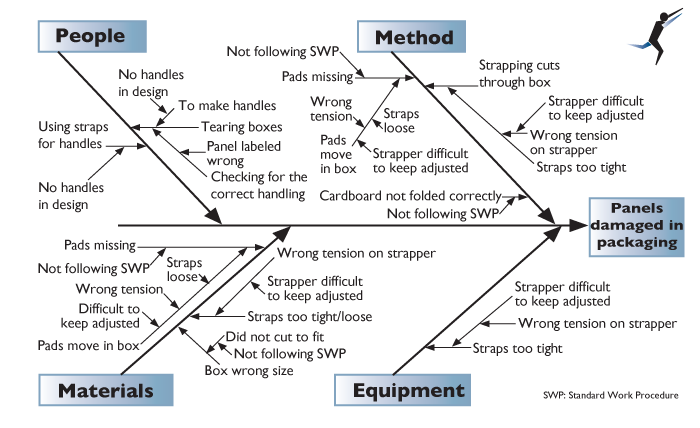
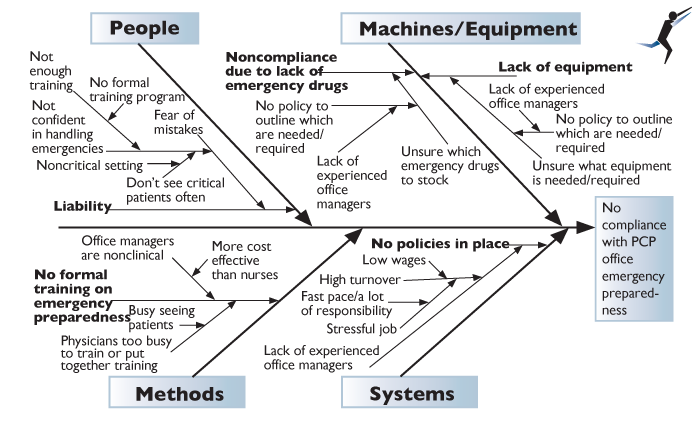
b) Draw major cause categories or steps in the production or service process. Connect them to the “backbone” of the fishbone chart.
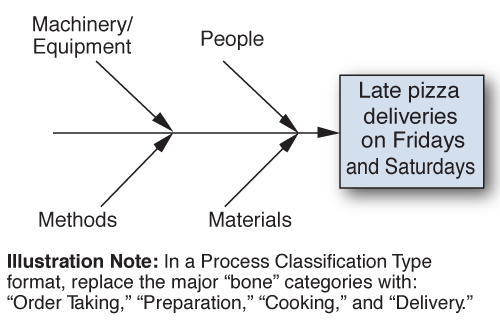
- Be flexible in the major cause “bones” that are used. In a Production Process the traditional categories are Machines (equipment), Methods (how work is done), Materials (components or raw materials), and People (the human element). In a Service Process the traditional methods are Policies (higher-level decision rules), Procedures (steps in a task), Plant (equipment and space), and People. In both types of processes, Environment (buildings, logistics, and space), and Measurement (calibration and data collection) are also frequently used. There is no perfect set or number of categories. Make them fit the problem.
c) Place the brainstormed or data-based causes in the appropriate category.
- In brainstorming, possible causes can be placed in a major cause category as each is generated or only after the entire list has been created. Either works well, but brainstorming the whole list first maintains the creative flow of ideas without being constrained by the major cause categories or where the ideas fit in each “bone.”
- Some causes seem to fit in more than one category. Ideally each cause should be in only one category, but some of the “people” causes may legitimately belong in two places. Place them in both categories and see how they work out in the end.
d) Ask repeatedly of each cause listed on the “bones,” either:
- “Why does it happen?” For example, under “Run out of ingredients,” this question would lead to more basic causes such as “Inaccurate ordering,” “Poor use of space,” and so on.
- “What could happen?” For example, under “Run out of ingredients,” this question would lead to a deeper understanding of the problem such as “Boxes,” “Prepared dough,” “Toppings,” and so on.
e) Interpret or test for root cause(s) by one or more of the following:
- Look for causes that appear repeatedly within or across major cause categories.
- Make selections through either an unstructured consensus process or one that is structured, such as Nominal Group Technique or Multivoting.
- Gather data through Check Sheets or other formats to determine the relative frequencies of the different causes.
Variations
Traditionally, Cause & Effect Diagrams have been created in a meeting setting. The completed “fishbone” is often reviewed by others and/or confirmed with data collection. A very effective alternative is CEDAC®, in which a large, highly visible, blank fishbone chart is displayed prominently in a work area. Everyone posts both potential causes and solutions on sticky notes in each of the categories. Causes and solutions are reviewed, tested, and posted. This technique opens up the process to the knowledge and creativity of every person in the operation.