 The Value Methodology 6 Phase Workshop Job Plan
1. Information Phase
"Good information is both truthful and relevant."– Carlos Fallon
The information phase continues at the beginning of the VM workshop as its first activity.
- Management address—Management opens the workshop and welcomes the VM team, stressing the importance of the workshop’s outcome to the organization, and asking for a presentation of results at the conclusion of the workshop.
- Project overview—The project designer, project manager, marketing representative, or process owner present their facts about the project, product or process and provide points of contact and telephone numbers for use by the VM team during the workshop.
- Project objectives —Prior to beginning the workshop, the VM team needs to have written objectives that they will be held accountable to achieve during the workshop. The VM team objectives should include specific needs to improve performance, quality and customer issues. They should also include a specific cost reduction target. A well written Project Charter should contain the overview and objectives. Some practitioners use a scoping document and agenda along with outlining the roles of the facilitator and team members. The charter or scoping document should be prepared with the representative who is commissioning the VM study and the VM practitioner who is expected to lead the VM Study.
- Evaluation of data gathered—In some applications, a design/construction VM study for instance, the VM team will have received and reviewed the project documents prior to the VM workshop. This of course, is preferred. In other applications, the VM team will see the project documents for the first time on the first day of the workshop. In all cases, the VM team reviews the information collected to date, determines what additional information they might need and collects it by requesting it after the project overview. As an additional benefit, the VM team may tour the project site, the plant, the operations, or whatever the nature of the project, product or process being studied, so they may see the project, product or process in use, production, and/or operation.
- Data detail—As a general rule, it is always better to have information at a workshop that is not used, than to need information and not have it. So always lean on the side of more detail, rather than less.
2. Function Analysis Phase
"All cost is for function. People want to eat fish, not bait a hook."– Lawrence D. Miles
The following material is from the Function Analysis Guide ©2016 published by SAVE International (ISBN 978-0-9961248-9-8). Please refer to the Function Analysis Guide for further information on this phase of the VM Job Plan.
Purpose
The purpose of the Function Analysis phase is to identify the greatest opportunities for the improvement of value. The Function Analysis phase is also intended to change the viewpoint of the VM team members. This change of viewpoint using function oriented thinking is where VM gets its power to accomplish great results. This is also what makes VM unique.
Questions
Answer these questions about the subject of the value study:
- What does it do?
- What is the cost of the function?
- Which functions offer the greatest opportunity to improve value?
Procedures
The key elements of Function Analysis, see figure 7.1 include:
- Define Functions
- Identify functions
- What are the functions of the project, product or process?
- Classify functions
- Are the functions basic, secondary, higher order or lower order functions?
- Organize functions
- Are the functions duplicative, defined correctly, or should they be grouped in a meaningful way?
- Identify functions
- Allocate Resources
- Prioritize Functions
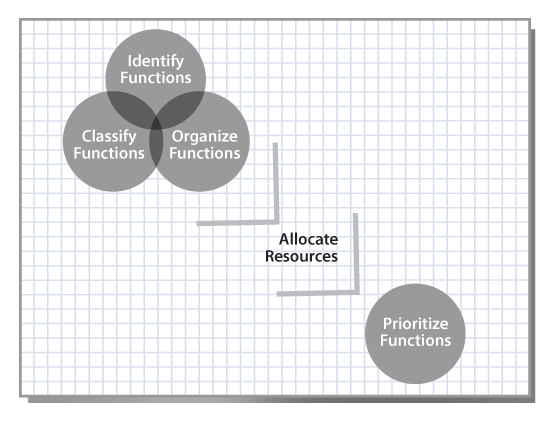
Define Functions
Defining functions is the crucial first step of Function Analysis. During this step, the VM team not only defines the functions, they identify, classify, and organize the functions.
Identify Functions
Function, in the case of VM, is described as an active verb and measurable noun. It is what a project, product or process must do to work and meet customer needs. Function-based descriptions establish a common language for the VM facilitator and the VM team. Once functions are defined using active verbs and measureable nouns, the VM facilitator and VM team can classify the functions to determine what function(s) is basic to the item under study.
The basic function is defined as the specific work the project, product or process must perform. Without this essential basic function(s), the project, product or process could not deliver the intended use for the customer. For example, a pencil cannot deliver the intended use of “Communicate Information” without performing the function of “Make Marks.” Therefore, “Make Marks” is the basic function.
Simple words. To state what something does in two words is sometimes difficult, but it helps to simplify terminology and create better understanding. The basic function of a chair is to “Support Weight”. A hammer has the basic function to “Deliver Force”. The stamping operation in a manufacturing plant has the basic function to “Shape Material”. Lights in a building have the basic function to “Illuminate Space”. Simple statements, such as these, ensure clarity of thought and communicate with little confusion of meaning. When choosing the words that define a function, make them as broad and generic as possible. Do not select words that predetermine a single way that the function should be performed.
Active verbs. Avoid the use of the words “provide”, “allow” and “facilitate”. Avoid using verbs that end with “ize”. Often when one of these verbs is used, the function can be reworded to become correct by making the noun a verb and finding a new noun. For example “Provide Support” becomes “Support Weight”. “Minimize Heat” can be replaced with “Reduce Heat”.
Number. It is common to make the verb plural, i.e., “Supports Weight” or “Resists Corrosion”. There is no need to make the noun plural.
Measurable nouns. Always strive for a measurable noun. This will take time and patience. Always try to determine the unit of measure for the noun. One can measure weight, torque, mass, corrosion, etc. Do not use the name of a component part that is included in the project under study.
See figure 7.2 for a list of typical verbs and nouns.
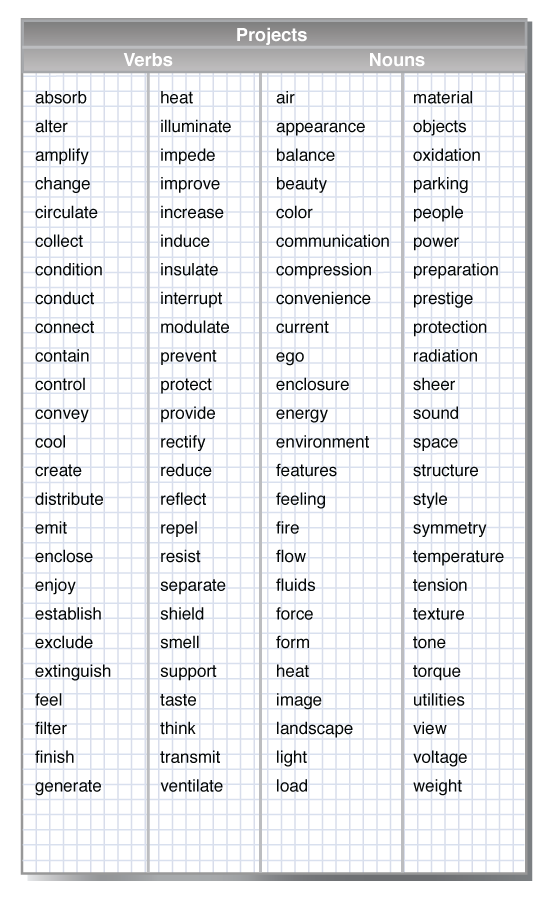
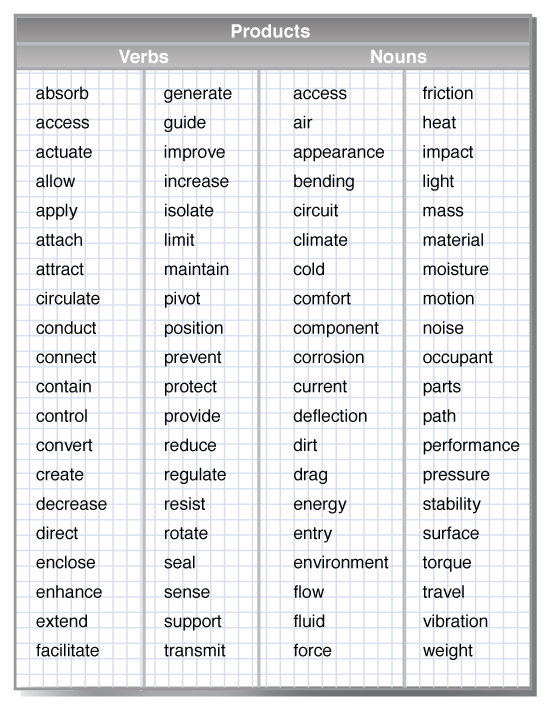
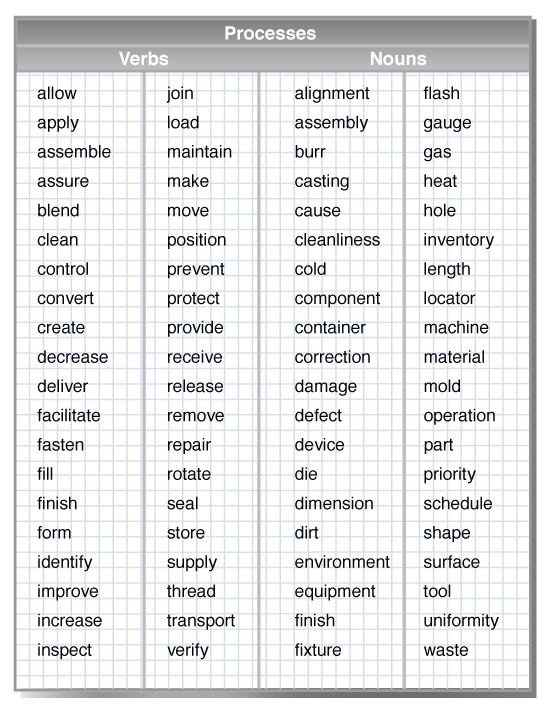
Operations vs. Functions: Do not use operations or activities as functions. Even seasoned value specialists fall into the trap of confusing functions with operations or actions that a device performs as a result of a function. This is especially true in studying a process. For example, “Drill Hole” is an operation, “Make Opening” is a function. In a mouse trap, “Swing Striker” is an action that the mouse trap performs as a result of the functions “Release Energy” and “Transfer Force”.
Combining Functions: Often component parts perform holding, supporting or positioning functions like “Hold Bearing” or “Position Washer.” It is best to combine all these hold, support, position functions into a single function such as “Hold Components”. By doing this, the VM team will better see how much cost is going into these functions. Brainstorming with this generic function will lead to many ideas. During the evaluation phase, the ideas can be sorted back to the actual area of the design to which they can be applied.
Understanding multiple use functions: Find out how something is used. A screwdriver whose designed function is to “Transfer Torque” might be used to “Pry Lid” off a can of paint and then “Stir Paint.” A standard door whose designed function is to “Control Opening” might be used to “Screen Occupant” in a dressing room. You should only use the intended use of the item as its function.
Function generation can be organized using the Function Identification Worksheet. See figure 7.3 for an example of a Function Identification worksheet for a wood pencil.
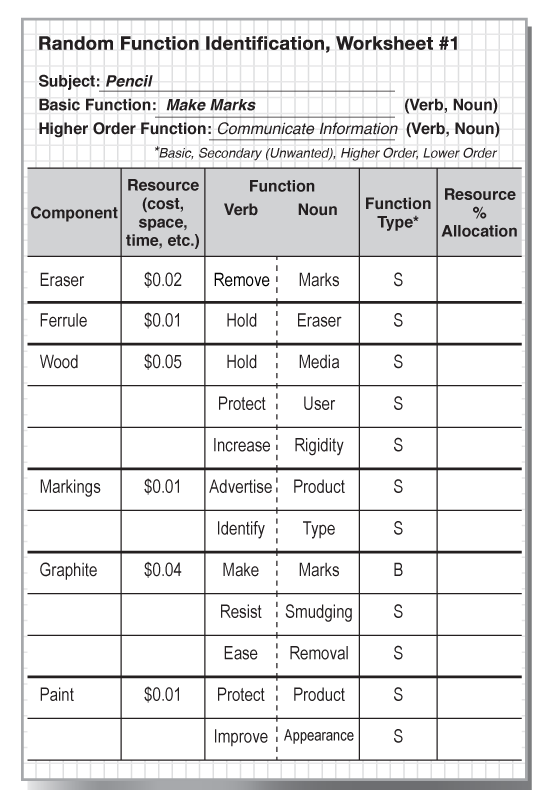
The listing of functions does not have to be completely random. For manufactured products, it is preferred to list all the component parts and identify the functions that each component part performs. In a similar manner, for construction projects functions can be identified by the major categories of the project. For example, a building can have many functions that relate to the sub-structure, external structure, internal structure, HVAC systems, etc. Process studies can identify the functions for each step of the process being analyzed.
Classify Functions
From the Function Identification Worksheet began in the previous step, the VM team classifies the identified functions.
The major function classifications are as follows:
- Basic Functions
- Secondary Functions
- Higher Order Functions
- Lower Order Functions
- Project, Product, or Process Objective Functions
- All Time Functions
- One Time Functions
Basic Function: A basic function is the primary purpose or most important action performed by a project, product or process. Without this essential basic function(s), the project, product or process could not deliver the intended use for the customer. A project, product or process can have more than one basic function.
The four rules that govern selection of the basic function include:
- The function describes the primary purpose and intent of the project, product or process;
- If you eliminate the function while still theoretically achieving the primary purpose and intent, it is not the basic function;
- The loss of the basic function(s) will cause a loss in value;
- The customer is willing to pay for it.
Secondary Function: A secondary function is a function that supports the basic function and results from the specific design approach that is used to perform the basic function. Secondary functions answer the question “What else does it do”? The VM’s team’s goal is to ultimately reduce or eliminate as many secondary functions as possible or at least to perform them in a new way to improve the value of the project, product or process being studied. There are secondary critical path functions that must logically align to achieve the basic function.
Unwanted Functions: These are functions, which by definition, are not wanted while the project, product or process is performing the basic or secondary function(s). In the example of a kerosene lantern, while the basic function of “Produce Light” is being performed, an unwanted secondary function of “Generate Odor” is being performed.
Higher Order Function: Higher order functions represent the specific goals or needs for which the basic function exists. They describe the outcome, output, or result of the basic function. An example of ball point pen is to “Communicate Information” while meeting the basic function of “Making Marks”. The highest order function is typically where there are other ways to perform the outcome or output of the basic function. As an example there are numerous ways to “Communicate Information.” Alternatives to communicating with a ball point pen might be to use a pencil, type an email, create a PowerPoint presentation. The highest order function view allows for a broader set of alternatives to consider to perform the basic function.
Lower Order Function: This function is typically the input to the project, product or process. It is outside the scope of the subject under study. However, it is needed to supply an logical input to the product, project, or service. As an example, if we examine a PC overhead projector, the “Supply Current” to the device is sourced at the outlet or that of electrical power. This part of the product is not part of the PC projector and therefore would fall outside the scope of a product study to improve or simplify a PC projector. On the other hand, the “Receive Current” function, represented by the power cord, is part of the PC projector product and considered part of the scope of study.
Project, Product, or Process Objective Function: These functions represent project, product, or process design or specification objectives which must be achieved by the project, product, or process of study. They are not part of the critical path but correspond to the objectives associated with the project, product, or process. As an example, “Streamline Process” might be an objective function for a process type VM study
All Time Functions: These functions can occur anywhere within the scope of study. An example, in the case or a PC projector, All Time Functions might be “Facilitate Portability,” and/or “Ensure Safety".
Organize Functions
Once the functions are identified and classified, the next step is to organize the functions. Functions are organized using a Function Analysis System Technique (FAST) diagram.
What is Function Analysis System Technique (FAST)?
A FAST diagram is a powerful, structured tool to identify, classify, organize, and analyze the “functions” of the project, product, or process under study. Charles W. Bytheway developed this innovation and presented it at the 1965 Society of American Value Engineers (SAVE) Annual Conference. This contribution to the VM tool kit added a new dimension to the Job Plan that set VM apart from other analytical techniques. It is important to note that FAST diagrams are precedent logical and not necessarily time or sequence oriented. Precedent function logic orientation determines how and why functions relate in a logical order.
Creating a FAST Diagram?
The first step in building a FAST diagram, which is known as organizing functions, is to ensure all the functions of a project, product or process are identified and classified. Function identification is accomplished by using an active verb and measurable noun, as mentioned above. Function classification includes identifying the basic function(s) and secondary function(s) as previously discussed. The functions are identified and classified using a Function Identification Worksheet as illustrated in figure 7.3

The FAST diagram template is shown in figure 7.4. A brief discussion on how to build a FAST diagram is provided below. Further information is contained in the Function Analysis Guide, published by SAVE International®.
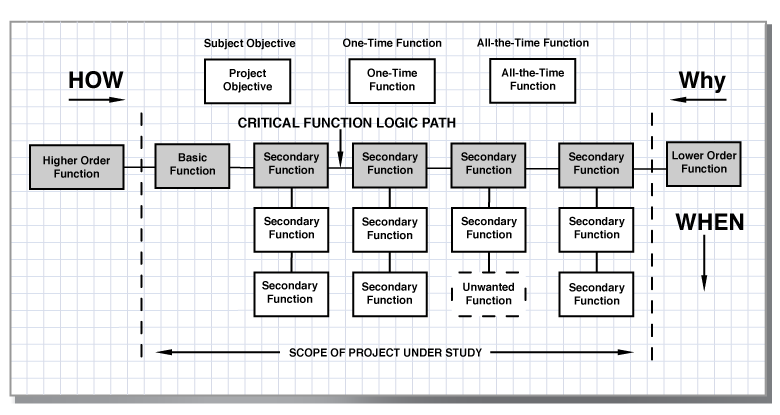
After identification and classification of functions, the VM team begins to organize functions by constructing a precedent logic-based orientation of functions starting with the basic function and asking the question “How?” moving from the basic function toward the right. It is important to validate the basic function of the project, product or process as this function produces what is required or expected by the customer. It’s what the project, product or process must do to satisfy what the customer wants, needs, or expectations. The basic function is essentially the purpose for the project, product or process to exist. The basic function is normally the starting point for building a FAST diagram.
The next function answering the question “How?” is then considered a Secondary Function which supports the basic function. After the Secondary Function to the right of the basic function is determined, the next Secondary Function is determined by answering the question “How?” and the answer should be another Secondary Function to the right. The VM team continues to ask the question “How?” until a series of functions forms what is referred to as the critical function logic path, which supports the basic function. Without these Secondary Functions, the basic function of the project, product or process will not perform its intended use. The critical function logic path functions are oriented in the horizontal direction and include the basic and Secondary Functions. As illustrated in the FAST diagram template, the critical function logic path is typically represented by a bold line.
In the horizontal dimension, while building the FAST diagram, organizing functions, using the “How” question, logic is periodically tested and confirmed by reversing and moving right to left asking the question “Why?” Each function has a precedent dependency moving in both directions from left to right and right to left.
To validate if a secondary function is actually secondary function on the critical function logic path, remove it from the diagram or simply ask if the corresponding function on either side of it in the “How” and “Why” direction makes logical sense. A function that does not pass the “How-Why” logic test is either described improperly or is in the wrong place. The answer must make sense.
Levels of Abstraction, as defined in the SAVE International® Function Analysis Guide, is “A logical progressive movement between functions aligned to form a horizontal critical function logic path,” and the progression of basic and Secondary Functions from the Lower Order,” (input), to “Higher Order,” (output.)
As shown on the FAST diagram template, note that the far left side of the critical function logic path contains a function labeled “higher order” function. The “higher order” function is the output of the project, product or process or what the customer expects to be accomplished. The “higher order” function(s) are not the basic function(s), as they are outside of the scope of the project, product or process.
The far right side of the critical function logic path locates the “lower order” function(s). This function is typically the input to the project, product or process. It is sometimes easier to think of these as assumptions that are necessary for the project, product or process to perform its basic function(s).
The right scope line is drawn to delineate the “lower order” input function(s) from the secondary functions, which represent the beginning of the scope of study. Similarly, a scope line delineates the “higher order” function(s) from the basic function(s). The functions between the scope lines represent the “scope” of the project, product or process under study.
When the critical function logic path is complete, there will normally be numerous functions that still need to be placed on the FAST diagram. Many of these will be displayed in a vertical direction and are referred to as “When” or “caused by” or “happens the same time as” functions. These functions support the basic and/or critical function logic path secondary functions. For example, unwanted functions are usually caused by a critical function logic path function and are typically displayed in the vertical dimension. It’s important to ask if removing or altering the secondary function results in a lower total cost of effective ownership or improves value to meet customer needs and expectations. Using the example of the ball point pen, when you “Dispense Fluid” you must also “Control Flow.” So, you can state, the “Control Flow” function is “caused by” or “happens the same time as ” the “Dispense Fluid” function. Functions that cause another function to occur may not be required, but is a byproduct of what the critical function logic path function is doing. As an example, the PC Projector has to “Convert Energy,” but, as a result has to “Dissipate Heat.” ”Dissipate Heat” is by nature an unwanted function. Therefore, the team may brainstorm ways to better manage the dissipation of heat.
Not all functions have a “How – Why” or “caused by” or “happens the same time as” relationship. In fact, it is normal to have several functions that are not connected in either the horizontal or vertical directions. Thus, there are three other areas on the FAST diagram for the remaining functions to be placed. Those areas are as follows:
Project, Product, or Process Objective Functions: These functions are those functions, which typically relate to government regulations, customer requirements, or engineering specifications. These functions are placed in the top left of the FAST diagram (refer to the FAST diagram template figure 7.4).
All Time Functions: These functions are those secondary functions that happen all the time (examples: “Improve Appearance” or “Assure Portability”). They typically relate to functions that help attract the customer (i.e. sell functions). These are displayed on the top right of the FAST diagram (refer to the FAST diagram template figure 7.4).
One-Time Functions: These functions are functions than happen only once. Packaging that is disposable to “Protect Product” is one example. Often there is cost in a product to make it easier to assemble. Thus, “Assist Assembly” is a one time function. These are placed at the top in the middle of the FAST diagram (refer to the FAST diagram template figure 7.4).
Function diagrams allow the VM team to have a visual representation of the project, product or process in a precedent logic format. As such, the VM team can analyze where they have opportunities to improve or maintain performance of function without degrading quality, maintainability, reliability, or safety criteria.
Steps to organize functions and construct a FAST Diagram. The following provides a step-by-step process for the construction of a FAST diagram once the functions have been identified and classified by the VM team:
a. Tape together pieces of flip chart paper or use a large sheet of drawing paper. Tape the paper on a conference/workshop room wall. (Note: This is usually done ahead of the VM workshop or during a lunch break so as to avoid unnecessary disruption or agenda delays).
b. Create a post-it note (3M® stickies) for each individual function and place them on a flip chart sheet. Note that some functions will be repeated several times during the random function identification step, but should ONLY APPEAR ONCE on the FAST diagram. Post-it notes are used as it is normal that as the VM team creates the FAST diagram, the functions are constantly rearranged.
c. Draw the left scope line on the paper.
d. Determine the basic function and place it to the right (inside) of the left scope line may also identify the Higher Order (output) function to the left outside the scope line. Logic must be checked by asking the questions “How?” is the Higher Order function achieved? The answer should be the basic function. Conversely, asking the questions “Why?” moving from the basic function to the left, should result in the “Higher Order” function.
e. Ask “How do I verb-noun” the basic function is achieved or performed. The answer should be the function to the immediate right. The resulting function is placed to the right of the basic function, and this function then becomes a secondary function.
f. Check the logic of these function relationships by asking “Why” this added secondary function is achieved or performed. Ask the question “Why do I verb-noun?” The answer should be the function to the immediate left (i.e. “So that I can verb-noun). This is moving in the reverse left toward the basic function. The answer should be the achievement or performance of the basic function.
g. If the answer to the “How” or “Why” questions does not logically fit, then there is a logic mismatch that must be resolved.
h. Build the FAST diagram as far as possible. When the critical function logic path makes sense using the “How – Why” logic in both directions, including the “lower order” and “higher order” functions you are finished.
See FAST example of a wooden pencil, figure 7.5
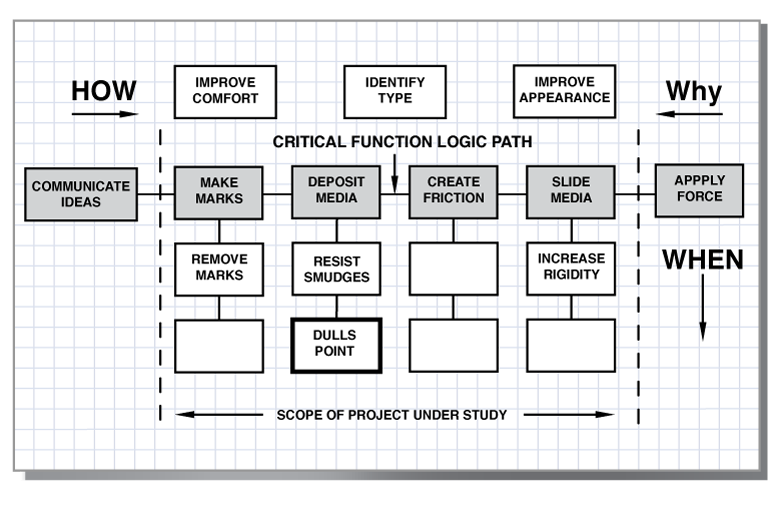
Allocate resources to all functions
Another important aspect of Function Analysis is the determination of cost/function relationships. It is this technique that identifies where unnecessary cost exists within the study item. Note that not all projects, products or processes use cost/function relationships. However, this relationship is the most common. Other projects may have function relationships to time, mass, weight or even a quality metric. Construction relationships to function can be space, profit, revenue, energy or even a LEED metric. The common denominator in all of these relationships is function.
A Function Resource Matrix Worksheet is used to develop this technique. See example for a wooden pencil, figure 7.6.
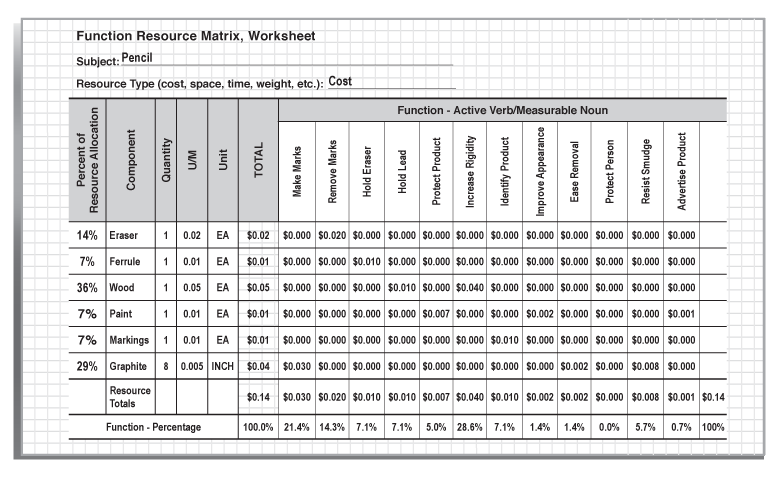
The steps for completing the Function Resource Matrix worksheet are outlined below:
1. Start by listing all functions between the scope lines across the top of the form.
2. List the parts or major sub-assemblies down the left-hand side of the form with the associated incremental costs.
3. Check off which function(s) are impacted by each part or sub-assembly.
4. Determine how much of the cost of the part or sub-assembly belongs to each function.
5. Add all columns vertically to determine how much cost is allocated to each function.
Cost-Function relationships provide direction to the VM team by illustrating the areas of the project, product or process with the greatest opportunity for cost and value improvement. In other words, at this point, the VM team is able to identify which functions are not providing good value. Having completed this technique, the VM team is ready to key in on specific functions and develop additional alternatives. They are ready for the next phase of the Job Plan, the Creative Phase.
Prioritize Functions
The last step of Function Analysis is to identify functions with the greatest opportunity for improvement that is the focus for the Creative Phase.
Typical ways to prioritize functions include:
- Focus on the functions with the highest costs in order to generate ideas with potential for value and/or efficiency improvement
- Focus on functions that are not performed acceptably (quality issues)
- Focus on functions which require high resources
- Focus on functions which are high risks to the project
- Focus on functions that are not environmentally significant
- Focus on functions that customers, clients, stakeholders, or users have expressed a concern
See figure 7.7 for an example of a FAST for a wooden pencil with functions prioritized based on cost.

3. Creative Phase
"Mind tuning is an essential step in problem solving." – Lawrence D. Miles
Purpose
Generate a large quantity of ideas or alternatives to perform the selected functions identified from the Function Analysis phase. Although there a number of brainstorming techniques, the Osborne process is the most typically applied.
Questions
Answer these questions:
- What else will perform the function?
- What else will do the job?
- Does the job need to be done at all?
- Can functions be combined?
Procedures
It is important to decide which functions have the most opportunity to improve value and take those into the creative phase. It is common to have a significant number of functions on a FAST diagram and thus time does not permit to brainstorm each function. In most situations, five to six functions contain more than fifty percent of the total cost. So pick high cost functions to brainstorm. There may also be some low cost functions that are not performed very well, have performance or quality issues or customer complaints. These functions also need to be addressed in the creative phase regardless of their cost. Establish an open-minded atmosphere for creativity. Set the ground rules. Set aside a specific time and place for the generation of ideas. Establish a significant goal for the number of ideas. Disallow comment on any idea as it is expressed – not even a snicker.
Alex Osborne developed the classical style of brainstorming which is the most common technique used to generate ideas during a value study. A number of techniques have been found to improve creativity and to be particularly appropriate for architects and engineers because the relative ease with which they can be applied in design problems. Although it is universally known and practiced, there are specific rules governing the brainstorming process that are not so well known or practiced, which include:
- Look for a large quantity of ideas.
- Do not worry about quality of ideas.
- Defer all judgment of ideas until the next phase.
- Cease and stop any criticism of ideas
- Judgment is restricted for the “Evaluation Phase.”
- Promote combining old ideas with new ideas.
- Encourage hitch-hiking on ideas.
The brainstorming technique works best if everyone in the room is willing and eager to participate. In a proper VM workshop, creativity needs to be performed by brainstorming ideas by function. Let all participants clear their minds by listing those pent-up ideas they have been holding back since the information and Function Analysis phases. It is best to brainstorm a single function at a time. Stay with that function with a goal of obtaining as many ideas as possible. When the minds of the VM team are too exhausted to generate ideas on the first function, then move to the second function on the list to be brainstormed.
List each idea on large flip chart sheets and hang them around the room for all to see as each chart fills up. Let the mind incubate and develop more ideas. Allow sufficient time for thinking, reflecting – don’t judge the ideas on the same day they are created! Additional ideas can come in the next day and be added to the list for consideration. Ask for them.
Remember in the creative phase the team is looking for ideas, not solutions.
- A solution requires justification and validation. An idea needs no justification.
- A solution is an end point. An idea is just the beginning.
- A solution is solid and self-supporting. An idea is tender and must be built upon.
Remember: Creativity = Imagination + Inspiration + Illumination!
4. Evaluation Phase
“Unfortunately, most decisions are made on a basis of avoiding or minimizing personal loss.”
– Lawrence D. Miles
Purpose
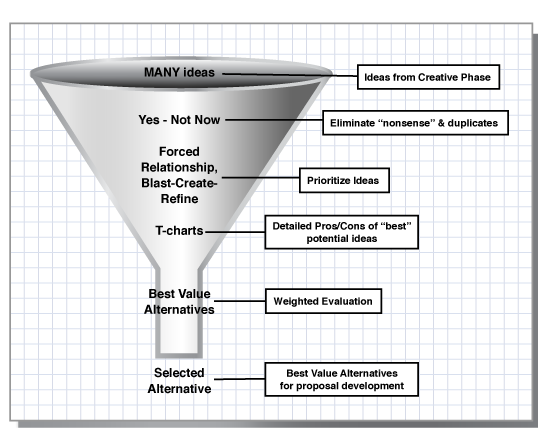
The purpose of the evaluation phase is to judge the ideas generated during the creative phase. The many ideas from the Creative Phase are filtered to the best value improving alternatives to bring to the Development Phase. See figure 7.8 Idea Evaluation and Filtering.
Questions
Answer these questions about each idea:
- Will the idea achieve the basic function?
- Will required performance and quality be achieved?
- Will the idea improve value?
- Is it readily implementable?
- Are there significant roadblocks to overcome?
Procedure to Classify/Rank the ideas
During the creative phase, the VM team was asked to withhold its judgment. During the evaluation phase, the team screens those raw ideas to reduce them to a manageable quantity. A recommended filtering process consists of three (3) steps.
Step 1. As a way to reduce the number of raw ideas, the first step can be to remove the ideas that are “nonsense” or simply not feasible. This is usually expressed by the gut feel of the VM team. In the spirit of the creative phase, where every idea is a good idea, now is the time to remove the ideas that do not have merit. The rule for this step is if one person wants to keep an idea, it should be kept for further evaluation. Otherwise, it can be eliminated for further consideration. Although eliminated, the idea can be resurrected at a later time.
For example: “YES” can be used to indicate an idea that appears feasible and/or with a little bit of research as it has a high probability of success. Mark with a “Y” or check mark on the evaluation flip chart worksheet. “NOT NOW” or “H” for “Hold,” can be used to indicate an idea that appears to have little or no potential at the present time, but maybe reconsidered later. For an idea the team unanimously believes has no merit to contribute to value improvement, simply mark an “X” through the number of the brainstorm item and/or strike through the idea by lightly lining through it. Often these ideas require significant work to investigate and/or implement and the team doesn’t feel confident it’s worth pursuing it further. Ideas are never completely eliminated because any of them can be revived at a later time. There are supplemental techniques to give a numerical value of importance to the idea or use a matrix to evaluate all ideas. However, striking through ideas which the team unanimously feels has little or no value to pursue is the essential first step.
Remember, a new idea is a young and tender thing. The initial objective here is to protect the ideas so they get a fair opportunity at being evaluated, not to see how many you can discard. At the beginning, it may not be clear to the VM team how some of these ideas, when combined with others, may lead to an important discovery for a project, product or process improvement.
As the VM team classifies/ranks ideas, use flip chart sheets with guidelines to encourage participation and think about these reminders:
- Consider everything.
- Be reasonable.
- Be fair. The past is not sacred!
- What ideas seem feasible?
- Can any ideas be modified or combined with another?
- Will each idea satisfy the user’s needs?
Often, additional ideas are generated during this phase. If this occurs, add the new ideas to the brainstorming worksheets and classify/rank them too.
Step 2. After the VM team has deleted the “nonsense” or hold ideas for possible re-consideration later, they may use one of several methods to further filter the ideas.
As Albert Einstein said, “Sometimes the solution presents itself politely and says, ‘Here I am!’.” While this happens, you will need one of the two methods below to generate alternative proposals.
The first method, “The Forced Relationships Method”, combines ideas into relationships, some of which will be quite unconventional. The Forced Relationships method consists of three steps:
1. Categorize Ideas: Determine three or four (possibly more) categories into which your “YES” ideas logically fall. The exact number of categories and the categories themselves depend on your specific study and the ideas that were generated. The effort is performed for each function that was brainstormed. It is not common to have the same categories for different functions. So do not try to force fit ideas into pre-determined categories.
The categories for one product study emerged as materials, structures, fasteners, and configurations. In one process study, the categories were: moving, storing, fabricating, and inspecting, while in another process study, the categories included collecting, transmitting, auditing, and displaying data. In any case, the categories should emerge naturally from your ideas and should be copied onto the Idea Categorization Worksheet across the top (see figure 7.9)
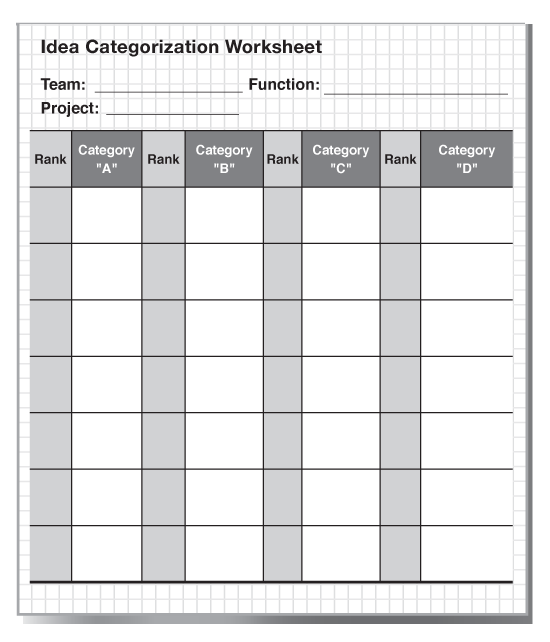
2. Cost-Rank Ideas: Place the ideas on the Idea Categorization Worksheet under the categories in cost-ranked order with the lowest cost-ranked idea on top. Simply cost-rank the ideas. Estimating them at this point would waste your time.
3. Combine Ideas: Select the lowest cost-ranked idea from each category and combine them, that is, force a relationship, into a proposal that will perform the function(s) that you brainstormed. Then repeat the process, moving to the next lowest cost-ranked idea in a category and combine it with the lowest cost-ranked ideas in other categories and then the next. Most of these combinations will not fit together because the ideas are mutually exclusive. Other combinations will surprise you by developing proposals that are truly innovative.
The second method, "The Blast-Create-Refine Method", is an intriguing option since it employs brainstorming in a developmental manner. It is based on the principle that far more unnecessary costs can be removed by reducing a project, product, or process to the functional bare minimum and adding only those features necessary to make it work and sell, than it is to attempt to remove portions of unnecessary cost from the existing project, product or process. This method requires three steps, which include:
1. Blast the existing project, product or process from your thinking. Forget all the project attributes, sequences, equipment, tooling, materials, layouts, formats, shapes, sizes, or process steps.
2. Create or brainstorm a simple, cost-effective way to perform the function and generate the bare minimum of what is needed.
3. Refine by adding only those features absolutely necessary to make it work and sell.
Repeat these steps to generate several different alternatives. Your “yes” ideas provide the impetus for creating and refining. This powerful method is a classic case of “easier said than done.” The key to using the blast-create-refine tool successfully is to over-simplify the function to maximize the use of the VM team’s creativity.
Step 3. T-chart ideas. After the VM team has developed several promising alternatives using either “Forced Relationships” or “Blast-Create-Refine”, the team is ready to move into the next stage of idea evaluation.
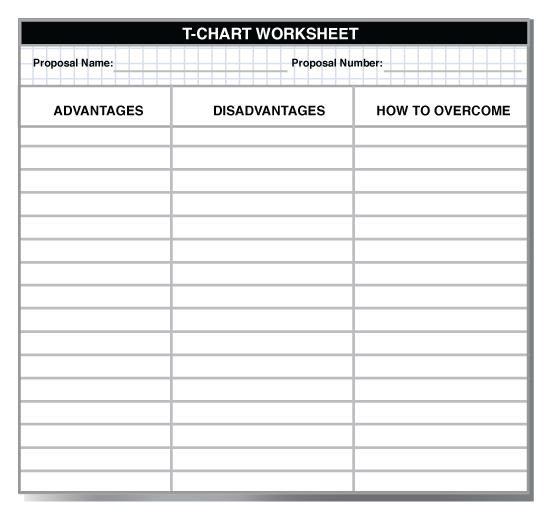
Prepare a T-chart worksheet for each proposal (see example figure 7.10).
To do this:
1. List all advantages of the idea in the first column. If the team takes this exercise seriously, they will surprise themselves how many advantages they will place on the list. It does not matter how small an advantage is, if it is an advantage it belongs on the list.
2. List the disadvantages in the second column. Be honest. Only rarely are there no disadvantages. Play the “devil’s advocate" role and anticipate why others may want to kill the proposal. Be prepared for people that will resist implementing any changes.
3. Determine how each disadvantage can be overcome by asking, “How can we make it work?” Write your answer in the third column, opposite the disadvantage.
There are several other acceptable techniques and tools which can be applied during the evaluation phase, these are:
- Delphi Method (See Appendix B)
- Choosing By Advantages (See Appendix L)
- Weighted Evaluation Techniques or Paired Comparison (See Appendix I)
Pugh Selection and Kepner-Tregoe are also acceptable techniques. However, these are not covered in the appendix of this VM Memory Jogger®. In addition, some practitioners combine T-charting during the development phase and include the advantages and disadvantages of the idea on the VM alternatives Worksheet.
It may be a good idea to segregate the final list of ideas/alternatives into three groups based on their probable time to implement: short time, needs more evaluation, long time to develop.
- Evaluate achievement of basic function by comparison.
- Use standards to compare methods, products, materials, etc.
- Quantify and put a dollar value on proposals or alternatives and refine.
- Predict user or customer response to each idea or alternative.
5. Development Phase
“Bring roadblocks clearly into the open.”
– Lawrence D. Miles
Purpose
The purpose of the development phase is to develop specific proposals, which are ideas/alternatives selected from the evaluation phase, for change to improve value.
Questions
Answer these questions about each alternative:
- What change is specifically recommended?
- Why is it technically acceptable?
- Why is it financially acceptable?
- What is the cost?
- What are its benefits?
- Are there any tradeoffs?
- What is the life cycle cost?
- How long will it take to implement?
- How will it be implemented?
- Who will implement it?
Procedures
Simultaneously develop the value proposal to sell it to two audiences, the technical audience and the business audience i.e. the project stakeholders.
Technical case
The technical audience includes design, engineering, manufacturing, production, distribution, warehousing and maintenance specialists and/or process owners. In order to develop and present the technical or business case to its best advantage, do the following:
- Compare the proposal to the current solution or as-is project, product or process to explain how the proposal will provide required functions while performing at or above requirements for reliability, operability, safety, quality, durability and maintainability.
- Contact vendors and specialists for supporting information regarding the new proposal. Investigate new methods, processes, software, and/or materials in the new idea.
- Prepare the written Value Proposal describing the original design and the proposed alternative for change.
- Be specific and detailed as to what changes are recommended.
- Be specific as to the scope of the change.
- List the advantages and disadvantages of the change.
The VM team should anticipate and mitigate the roadblocks, concerns, or objections the technical or managerial audience will have by specifically demonstrating how the new proposal is better value than the original project, product or process. Some of the reasons for the value improvement may be because the proposed value alternative may:
- Lower initial or life cycle cost
- Increase initial cost but reduce or improve life cycle costs
- Increase the rate of production
- Reduce complexity
- Improve the schedule, sequencing, and/or constructability
- Mitigate or eliminate major areas of risk.
- Improve reliability and quality
- Increase functionality to the customer or owner
This is the marketing component of VM and the phase of the Job Plan in which the VM team will influence implementation decisions. Be concise and to the point on why this alternative is both technically feasible and implementable. Sell the change with specific information about how this improves the project, product or process.
Business case
The business audience includes management, financial, marketing, and customer representatives. In order to develop and present the business case to its best advantage, do the following:
- Estimate the initial cost benefit of the proposal.
- Determine the breakeven point at which the proposal begins to cost less than the original solution. If F = fixed cost and V = variable cost, then the breakeven quantity X is: X = (F2 – F1) / (V1 – V2 ).
- Most manufacturing companies want to see the simple payback for each proposal. Simple payback is calculated by dividing the total cost to implement the change by the annual savings.
- Calculate the life cycle cost savings of the proposal in comparison to the original solution. LCC savings are an important user benefit that normally means less maintenance and operating cost during use, which equates to a customer concept of a higher quality product.
- Estimate the implementation cost of the proposal in terms of design changes, retooling, testing, and other overhead elements that drive the total cost of the project.
- Estimate the cost and benefit of retrofitting existing products or equipment as a separate economic decision and recommendation.
- Determine the return-on-investment (ROI) and/or probable new market share for the proposal.
- Indicate specifically what must be changed i.e. which design, what detail, what specification paragraph, what part number, etc.
- Develop the wording for each changed document or new sketch needed.
- If testing is required, minimize risk (and expense) by suggesting a testing plan to phase-in the tests to provide intermediate assurances of performance before continuing tests.
- Indicate who should make each change required to fully implement the proposal.
- Indicate when the change should be made and take effect to maximize its benefit in coordination with the ongoing development, production or construction schedule for the item.
- Draft internal implementing orders to be signed by management to the various departments or the design team approving the change and assigning implementation responsibility and deadlines.
Again, anticipate roadblocks and mitigate objections in advance. List the other intangible user benefits to be gained from the proposal, e.g. simplicity, style, appearance, handling, availability, weight, selection, convenience, and so on. Develop an implementation (action) plan that is both specific and practicable to achieve.
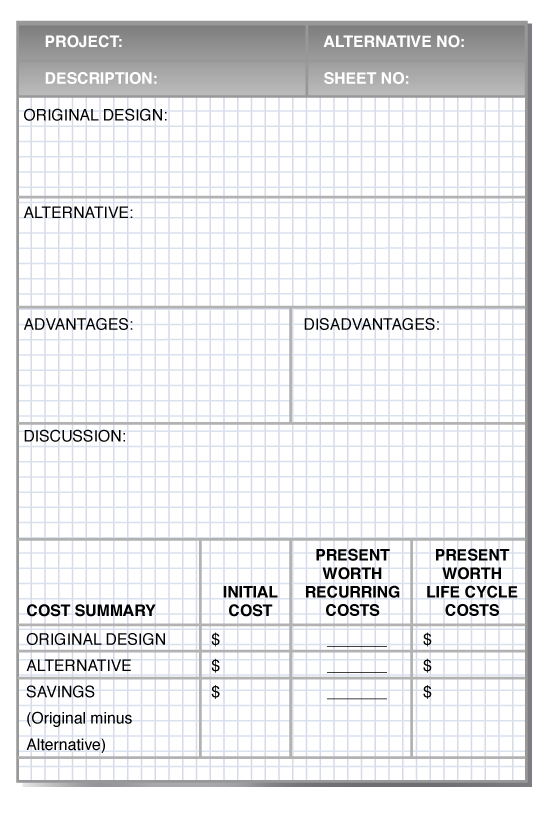
Once the VM team has prepared the technical and business cases for the value proposals, the VM team members will finalize the value methodology proposals, which will be submitted to the managers, owners, and stakeholders and which will include information such as:
- Technical description of the original concept and the proposed change
- The advantages and disadvantages of the change
- Any discussion mitigating the disadvantages which demonstrate why this proposal offers better value than the original project, product, or process
- Sketches of the change
- Computations, calculations, as appropriate
- A detailed cost estimate of the original and proposed change
- The cost to implement
- The life cycle cost benefits
- A proposed schedule for implementing the change
- An implementation plan for making the change
One example of a VM Alterative Proposal worksheet is shown in figure 7.11; “Value Methodology Alternative Proposal Worksheet.”
6. Presentation Phase
“Feelings always influence and often control decisions.”
– Lawrence D. Miles
Purpose
The purpose of the presentation phase is to sell your ideas!
Questions
Answer these questions about each value alternative:
- What is the specific change recommended?
- How does it perform all required functions?
- Is the change timely?
- Will the change meet the schedule?
- What financial benefits will the change achieve?
- What intangible benefits will be gained by implementation?
Procedures
The VM team will prepare a presentation of its results. While the presentation of a change will be in writing, it is the oral presentation that is necessary to clinch the implementation decision. Use the written report as the basis to make an outline of your oral presentation. See figure 7.12 for an example of an outline.

Prepare visual aids from your sketches.
Schedule a formal presentation with decision makers at a time when the VM team will have his/her full attention. Ensure the other stakeholders who will implement the changes are invited and able to attend the presentation. A good idea will never die if it is waiting its turn to be presented. However, it can surely be killed if presented in haste at the wrong time.
In some instances, the VM report (draft or final) is distributed in advance to the presentation attendees. In some situations, such as a manufacturing VM study, encourage a wide initial distribution of the report so the stakeholders can read the VM Proposals and be prepared for the presentation, and, conversely, to ensure that it does not sit on one person’s desk waiting for review and a decision about the presentation meeting date. However, in a design/construction VM study, the presentation of results most often occurs on the last day of the workshop. This activity should be scheduled and noted in the workshop agenda so the stakeholders are prepared for the meeting. The draft VM Proposals are distributed at the presentation of results meeting. Process VM studies can do either a presentation on the last day of the workshop or scheduled at a time convenient for management and stakeholders. However, it is advised to do some form of presentation as soon as possible. In a few instances Process VM teams have had to make multiple presentations to ensure all affected parties had a chance to review and comment on the proposed changes.
Rehearse your presentation with your VM team members. The presentation structure may be useful in one or two formats. For instance, the VM facilitator may present the results of the study alone with assistance from the VM team members, as necessary, to clarify technical components. A second approach may be for the VM facilitator to act again as the facilitator and have each VM team member present those VM Proposals which relate to his/her discipline or area of expertise. It is the facilitator’s decision on which way will best present your VM team’s work. However, if VM team members are expected to be part of implementation, it works best for them to be actively involved as they own the results. They become more engaged and committed to the changes they are proposing.
Before the Presentation meeting:
- Set up you room and make sure your visuals set up and I place working.
- Allow a minimum of 10-15 minutes before the presentation.
- Introduce the team.
- Be positive. Be concise.
- Distribute the VM team’s report (draft or final) and, if appropriate.
- Ask that the draft implementing instructions be signed and issued.
- Do not read the screen. Know what is on the screen and paraphrase the important points.
Top management is concerned with net benefit and disposition. Therefore, be sure to address the following points:
- Item/system performance is not adversely affected.
- Supporting technical information is complete and accurate within the time limits of the VM workshop.
- Potential savings are based on valid cost analysis with breakeven, return on investment, life cycle cost data.
- The change is feasible.
Remember to sell your ideas! Use your human relations skills. Praise the project team for the work they have done to date. Do not blame anyone or any organizational unit for poor value. Create a positive work environment and listen to the players in the ensuing discussion to ensure you are effective in conveying the benefits of the changes you propose. Management just spent their good money on having your VM team discover ways to improve value and they will get no return on investment for the VM study unless change is implemented. So praise those who will help approve and implement the VM Proposals! In addition, offer your services and that of your VM team to assist in implementing the recommendations, if they are not already assigned this responsibility.
The presentation of results should typically be viewed as the time to share information and ensure that the project team understands the changes and benefits of the VM Proposals put forth. Some VM Proposals will be obvious winners and there will be little need for discussion about the decision to implement. Others may take a little thought and research. Therefore, in general, a separate meeting should be held several days or a week or two later to formally determine implementation. This time the project team considers how best to proceed. The owner/project team will meet to finalize the decisions about each VM Proposal to either:
- Accept the VM Proposal.
- Accept the VM Proposal with modifications.
- Require further study.
- Reject the VM Proposal for specific, documented reasons.
There will obviously be situations in which immediate decisions must be made during the presentation of results – the schedule is usually the motivator in these cases
Conclusion
Following the Value Methodology 6 phase job plan in sequence guarantees an optimal outcome for your Value Methodology study. With practice over time, the practitioner will notice significantly improved results with each successive VM study.
