 Hypothesis Testing
Why use it?
Hypothesis testing is used to help determine if the variation between groups of data is due to true differences between the groups or is the result of common-cause variation, which is the natural variation in a process. This tool is most commonly used in the Analyze step of the DMAIC method to determine if different levels of a discrete process setting (x) result in significant differences in the output (y). An example would be “Do different regions of the country have different defect levels?” This tool is also used in the Improve step of the DMAIC method to prove a statistically significant difference in “before” and “after” data.
What does it do?
- Identifies whether a particular discrete x has an effect on the y
- Checks for the statistical significance of differences. In other words, it helps determine if the difference observed between groups is bigger than what you would expect from common-cause variation alone.
- Gives a p-value, which is the probability that a difference you observe is as big as it is only because of common-cause variation
- Can be used to compare two or more groups of data, such as “before” and “after” data
How do I do it?
- Collect and plot the data
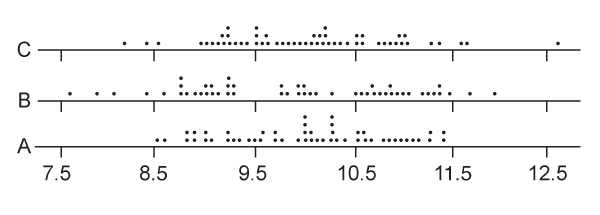
- You might want to make stratified histograms for the different data groups so you can get a feel for the data. Here, data collected on time to close a loan is plotted for three different loan types (A, B, and C).
- Here the hypothesis being tested is that the three different types of loans take the same amount of time to close. The hypothesis test will tell us the likelihood of that being true, even though the data plot is inconclusive.
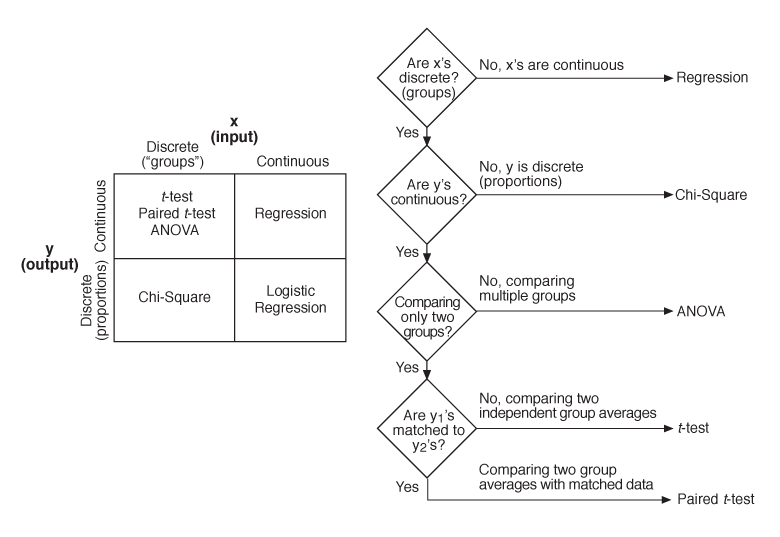
- Select the appropriate test
- The type of hypothesis test you use depends on the type of data you have. Use hypothesis tests when the x is discrete. (See the table below. Use the flowchart on the right as a guide for selecting the appropriate type of hypothesis test to use.)
- Since the y in this example (time to close) is continuous and the x (loan type) is discrete, Analysis of Variance is the appropriate type of test to select.
- Analyze the data
- Hypothesis tests compare observed differences between groups.
- Hypothesis tests give a p-value. This value equals the probability of obtaining the observed difference given that the “true” difference is zero.
- A p-value can range from 0.0 to 1.0 (i.e., from a 0%chance to a 100% chance).
- Usually, a p-value of less than .05 indicates that a difference is significant. When you get a p-value of less than .05, then conclude there is little chance that the true difference is zero.
- When a difference is significant, you can conclude that the data groups are different. You can then investigate x as a driver of y or conclude there is a difference in the “before” and “after” data.
- For this example, the averages of the three groups are as follows: A = 10.02, B = 9.86, and C = 10.03. The hypothesis test gives a p-value of 0.56—larger than 0.05, which indicates that the differences in the group averages are small. This means that there is not enough evidence to conclude that the different loan types have different cycle times.
Variations
Many statistical procedures have built-in hypothesis tests. For example, in regression analysis (see page 214 for details), p-values are given on a slope. These values come from a test of the null hypothesis that the slope is zero (i.e., there is no difference in slope).
For more information on Hypothesis Testing see The Black Belt Memory Jogger®.