 Binary Logistic Regression
Why use it?
Binary Logistic Regression (BLR) is used to establish a y = f (x) relationship when the dependent variable (y) has just two possible values. Similar to regression, it explores the relationships between one or more predictor variables and a binary response. BLR enables the DMAIC team to predict the probability of future events belonging to one group or the other.
What does it do?
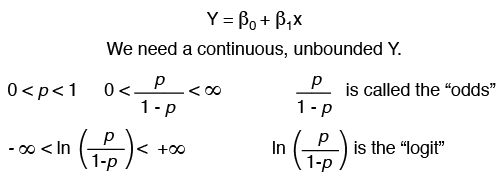
The predictor variables (x’s) can be either continuous or discrete, just as for any problem using regression. However, the response variable has only two possible values (e.g., pass/fail). Because regression analysis requires a continuous response variable that is not bounded, this must be corrected. This is accomplished by first converting the response from events (e.g., pass/fail) to the probability of one of the events, or p. Thus if p = Probability (pass), then p can take on any value from 0 to 1. This conversion results in a continuous response, but one that is still bounded. An additional transformation is required to make the response both continuous and unbounded. This is called the link function. The most common link function is the “logit,” which is explained below.
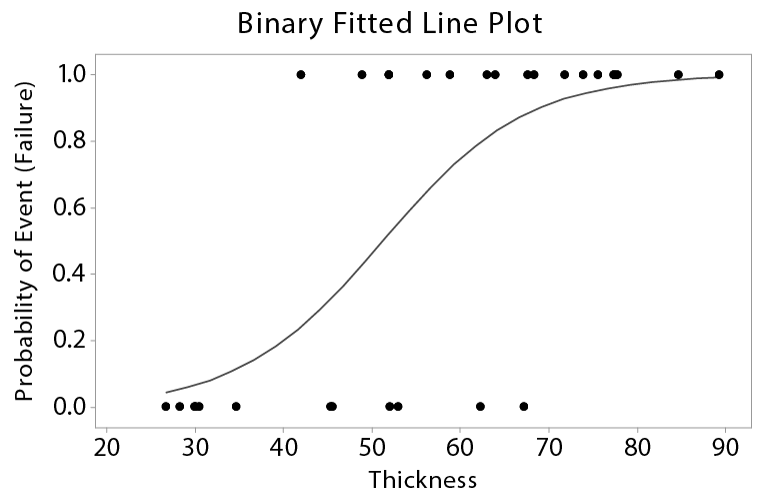
BLR fits sample data to an S-shaped logistic curve. The curve represents the probability of the event.

At low levels of the independent variable (x), the probability approaches zero. As the predictor variable increases, the probability increases to a point where the slope decreases. At high levels of the independent variable, the probability approaches 1.
The following two examples fit probability curves to actual data. The curve on the top represents the “best fit” where probabilities less than 0.5 are coded as a non-event and probabilities greater than 0.5 are coded as an event. The curve through the data on the bottom contains a zone of uncertainty where events and non-events (1’s and 0’s) overlap.
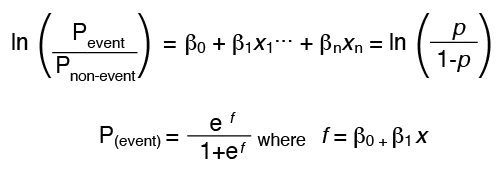
If the probability of an event, p, is greater than 0.5, binary logistic regression would predict a “yes” for the event to occur. The probability of an event not occurring is described as (1-p). The odds, or p/(1-p), compares the probability of an event occurring to the probability of it not occurring. The logit, or “link” function, represents the relationship between x and y.
How do I do it?
- Define the problem and the question(s) to be answered
- Collect the appropriate data in the right quantity
- Hypothesize a model (use a link function such as logit, probit, or gompit)
- Analyze the data
- Many statistical software packages are available to help analyze data
- Check the model for goodness of fit
- Check the residuals for violations of assumptions
- Modify the model, if required, and repeat
Interpreting the results of BLR
Most statistical software will estimate coefficients, which represent the change in the logit, or ln(p/(1-p)), corresponding to a one-unit change in an x variable, if all other x variables are held constant. One advantage of the logit link function is that it provides an estimate of the “odds ratio” for each predictor in the model. This is the ratio of the “odds” with a particular x at some base value (x0) compared to the “odds” if the same x variable were increased by 1 unit (i.e., x = x0 + 1). The “odds ratio” for each x variable is calculated directly from the coefficient (β) for that x (i.e., it is eβ).
Positive coefficients mean that the predicted probability of the event increases as the input (x) increases. Positive coefficients also result in an odds ratio that is > 1.
Negative coefficients mean that the predicted probability of the event decreases as the input (x) increases. Negative coefficients also result in an odds ratio that is < 1.
A coefficient of 0 means that there is no change in the predicted probability of the event as the input (x) increases. This also results in an odds ratio that is = 1. Variables with coefficients close to 0 or odds ratios close to 1 can be removed from the model.
In the following example, the thickness dimensions of 30 glass screens were measured and then the screens were subjected to a thermal crack test. Items were inspected and rated as pass or fail. A value of 1.0 means the event is a “failure.”
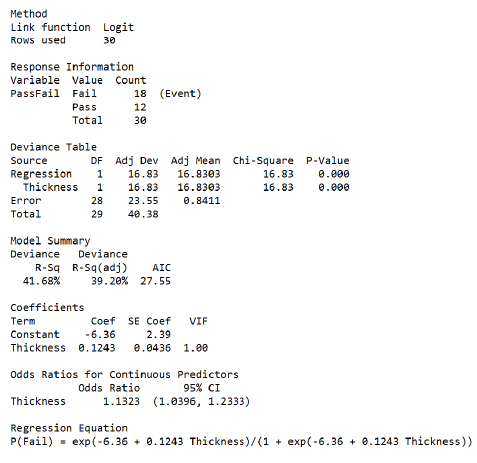
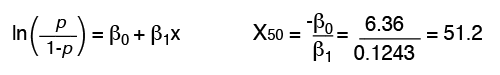
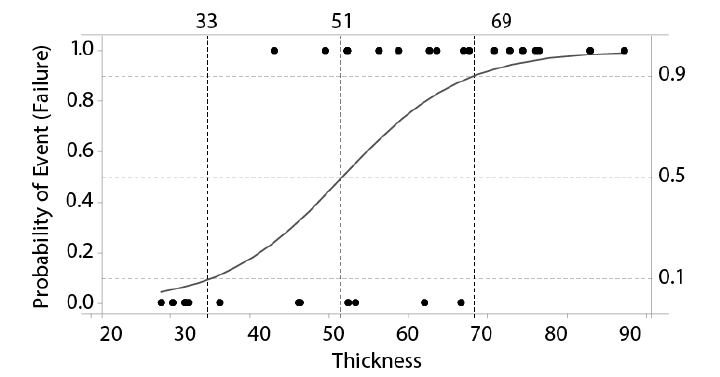
A dimension of 51 has a 50% probability of failure. As the dimension increases, it is more likely to cause a failure. Two other dimensions have also been highlighted: a dimension of 33 only has a 10% probability of failure while a dimension of 69 has a 90% probability of failure.